AlliedOffsets Metabase Platform Guide
A comprehensive guide to getting started and making the most of your AlliedOffsets Metabase platform access.
Getting Started with the AlliedOffsets Platform
Welcome to AlliedOffsets! This guide will help you get started with the Metabase platform and make the most of the voluntary & compliance carbon market data available to you.
About the Dashboard
The AlliedOffsets Dashboard contains the world's largest data source on carbon offsetting projects and prices. It is an online interactive platform containing our full database of 34,000+ carbon offsetting projects around the world, 16,000+ corporate buyers' data, pricing, 12+ compliance scheme monitoring, and everything in between. The data is refreshed 3x a week (Monday, Wednesday, Friday) with updates direct from the registries.
Account Creation Process
- You'll receive an invite email from Metabase (check spam if not received within 15 mins)
- Create an account using your email address and choose a password
- For subsequent logins, select "log in with your email"
Workspace Access
In Metabase, Explorer users will have access to both Personal Collection and company-specific workspace:
- Personal Collection: Private workspace visible only to you and admins.
- Company Workspace: Shared space for all members of your organisation with an AlliedOffsets subscription
Interface Overview
When you log into Metabase, you'll see the following main elements:
- Left Navigation Panel: Access to different sections including Premium Dashboard
- Home Page: Quick access to recently added and featured dashboards.
- Premium Dashboard: Access to all AlliedOffsets modules you have access to
- Question & SQL Builder: Tools for creating custom questions and analyses
Point of Contact
For any further questions, feedback or requests, please message our Customer Success Coordinator Mo at [email protected].
Data Overview
The AlliedOffsets database provides comprehensive data on carbon offsetting projects, registries, methodologies, and transactions. This section provides an overview of the data structure and available tables. All tables shown on the schema below can have a question built through them.
Data Schema
The database is organised into several interconnected tables that allow for comprehensive analysis of the carbon offsetting market:
Data Relationships
Understanding the relationships between tables is crucial for effective data analysis:
- Projects → Credits: One-to-many relationship. One project can have multiple credit transactions.
- Credits → Buyer Supplementary Info: Many-to-one relationship. Many credits can be purchased by one buyer.
- Projects → Developer Info: Many-to-one relationship. Many projects can be created by one developer.
- Credits → Compliance Eligibility: One-to-one relationship. Each credit has one compliance eligibility record.
Important: When joining tables, be aware of potential data duplication. For example, joining Projects with Credits will duplicate project rows for each credit transaction.
Table Schema Reference
PROJECTS
- UID: Unique identifier (primary key)
- Project name: Name of the project
- Registry: Registry where the project is registered
- Methodology: Methodology used by the project
- Country: Country where the project is located
- Project Sector: Type of project (e.g., Forestry, Renewable Energy)
- Indicative project price: Price per credit as predicted by the
AlliedOffsets Machine Learning model
- Project developer: Entity that developed the project
CREDITS
- Credit Serial Number (AO Value): Unique identifier for the credit
transaction
- Project UID: Reference to the project (foreign key to PROJECTS.UID)
- Transaction type: Type of transaction (issuance, retirement, CDR
off-registry purchase etc.)
- Credit volume: Number of credits in the transaction
- Vintage year: Year the credits were generated
- Transaction date: Date of the transaction
- Buyer: Organisation that purchased the credits (foreign key to
BUYER_INFO.Company)
BUYER SUPPLEMENTARY INFORMATION
- Company: Name of the buying company (primary
key)
- Sector: Industry sector of the company
- Headquarter Country: Headquarters location
- Region: Geographic region
- SBTi or NzT Commitments: Whether this entity has
committed to either SBTi or Nzt
- Date of SBTi Commitment: If present, when the commitment was made
- Nzt Last Updated: Latest update on their Net Zero target
Exploring Data
Metabase provides powerful tools for exploring and visualising data. This section covers how to navigate the interface and use these exploration features.
Browsing Tables
To browse the available tables:
- Click on "Browse Data" in the left navigation panel
- Select "Databases" -> "AlliedOffsets read only" to see all available tables
- Click on any table to view its contents
When viewing a table, you can:
- Sort columns by clicking on column headers
- Filter data using the filter bar at the top
- Visualize the data by clicking the "Visualization" button
- Save your view as a "Question" for future use
Joining data
The next step would be joining together the data to further build your custom view. Once you click on the 'Join Data' button, you will be prompted to select the data that you want to add.
In this example, we have joined the original 'AlliedOffsets Projects' data, with 'AlliedOffsets Credits' in order to get direct transaction data.
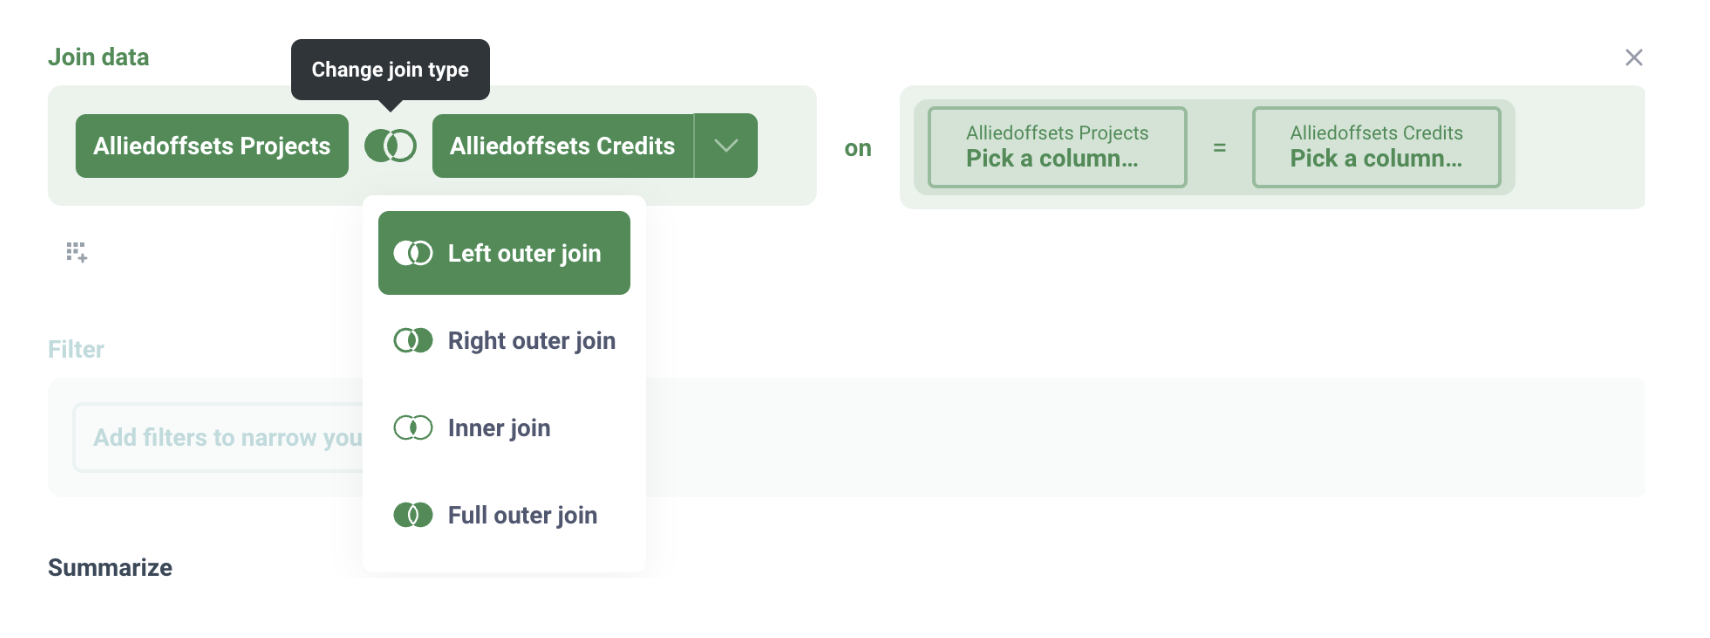
Metabase will then give you the option to select a type of join: the default is a left outer join, but you can change to right outer join, inner join, or full outer join.
The left outer join will select all records from 'AlliedOffsets Projects', along with records from 'AlliedOffsets Credits' that meet the join condition.
If you want to understand more about the different types of joining, you can look at the relevant page on the Metabase website.
A very common example is to join on an ID column in each table - so in this instance we have joined UID from "Credits" table on Project UID from the "Projects" table.
Using Filters
Filters allow you to focus on specific data points:
- Click the "Filter" button in the top right when viewing a table
- Select a column to filter on
- Choose a filter operator (is, is not, equals, contains, greater than, etc.) (Please note that this is the only way to filter for 'is not' in the data)
- Enter a filter value
- Click "Add Filter" to apply
You can add multiple filters to narrow down your data further.
Summarising data
Once the filters are selected, you can then choose how to summarise the data. Through summarising, you are essentially choosing how to aggregate the data from the previous step. Common metrics are typically Count, Sum of, Average of etc.
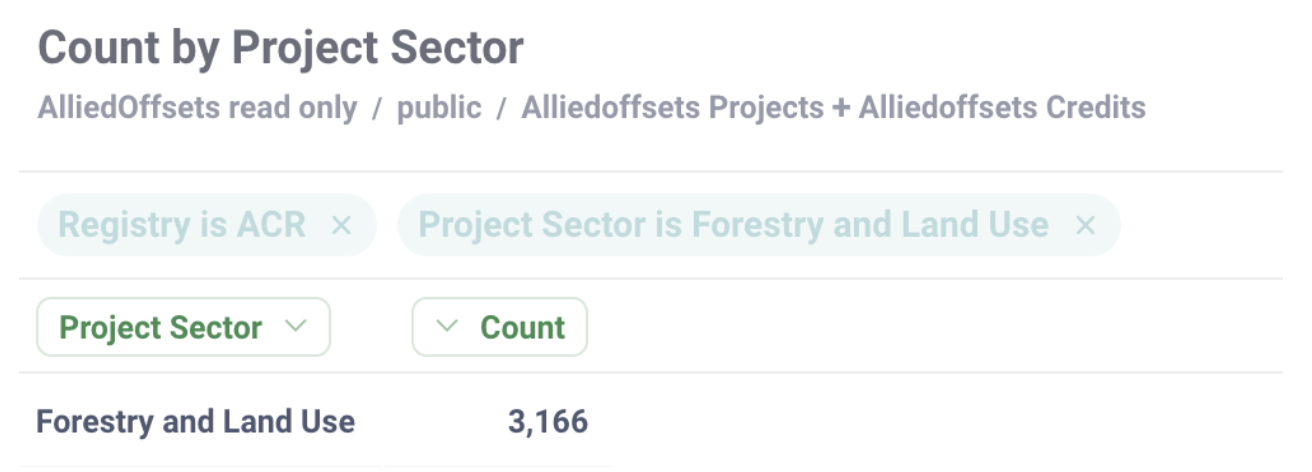
In this example, if I want to see a count of Forestry and Land Use projects that are attributed to the ACR registry, I can summarise by Count, and group by 'Project Sector'.

When I click on 'Visualise', this is the view I will then see:
Visualizing Data
Metabase offers various visualization options:
- Table: Default view showing raw data
- Bar Chart: Good for comparing categories
- Line Chart: Ideal for time series data
- Pie Chart: Shows proportion of categories
- Map: Visualizes geographical data
To change visualization type:
- Click the "Visualization" button
- Select your preferred visualization type
- Configure visualization settings as needed
Saving and Sharing
To save your analysis:
- Click the "Save" button in the top right
- Give your question a descriptive name
- Choose where to save it (Personal Collection or Company Workspace)
- Click "Save"
To share your analysis with team members, save it to your Company Workspace where all team members with access can view it.
Creating Questions
Metabase allows you to create custom questions (queries) to analyze the data in specific ways. This section covers how to create effective questions using both the interactive query builder and SQL.
Using SQL
For more advanced queries, you can use SQL directly:
- Click "New Question" in the top right of Metabase
- Select "SQL query"
- Write your SQL query
- Click "Run" to execute
SQL Examples
Here are some example SQL queries for common analyses:
Projects by Country
SELECT
  "Country",
  COUNT(*) as project_count
FROM
  projects
GROUP BY
  "Country"
ORDER BY
  project_count DESC;
Credits by Buyer
SELECT
  b."Company",
  SUM(c."Quantity") as total_credits
FROM
  credits c
JOIN
  buyer_info b ON c."Buyer" = b."Company"
GROUP BY
  b."Company"
ORDER BY
  total_credits DESC;
Projects with Transactions
SELECT
  p."Project name",
  p."Registry",
  p."Country",
  c."Transaction type",
  c."Quantity",
  c."Transaction date"
FROM
  projects p
JOIN
  credits c ON p."UID" = c."Project UID"
ORDER BY
  c."Transaction date" DESC;
SQL Tips
- Use double quotes for column names: Column names in the AlliedOffsets database often contain spaces, so they need to be enclosed in double quotes
- Be careful with joins: Joining tables can result in duplicate rows if not handled properly
- Use aliases: Table aliases (like 'p' for projects) make queries more readable
- Start with SELECT *: When exploring a new table, start with SELECT * to see all columns
- Use LIMIT: Add LIMIT 100 to the end of your query during development to avoid returning too many rows
For Effective Queries
- Start simple: Begin with a single table and add complexity gradually
- Use filters: Narrow down your data to focus on what's important
- Be mindful of joins: Remember that joins can duplicate rows
- Use aggregations: Summarize data to identify trends and patterns
- Choose appropriate visualizations: Different visualizations work better for different types of data
Use Cases
This section provides examples of how to use the AlliedOffsets data for common analysis scenarios. This is by no means all that is possible, and please feel free to message Mo ([email protected]) to transform your use case into a question/dashboard.
Supply and Demand Analysis
To analyse supply and demand in a market over time:
- Create a new question using the CREDITS table
- Join PROJECTS table through 'UID' common field
- Filter by desired Country/Transaction Date/etc.
- Filter by "Transaction type" = "Retirement" and "Transaction type" = "Issuance" to focus on Supply vs Demand
- Group by "Transaction date" (by month or quarter)
- Sum the "Sum of Credit Volume" column by Transaction Date & Transaction Type.
- Visualise as a line chart splitting "Demand" & "Supply" by "Retirement" vs "Issuance"
This will show you the volume of credits issued vs retired over time in a specific market segment
Project Type Comparison
To compare different project types:
- Create a new question using the PROJECTS table
- Group by "Project Sector"
- Count the number of projects
- Visualise as a bar chart
For a more detailed analysis, you can join with the CREDITS table to see the volume of credits by project type.
Buyer Activity Analysis
To analyze buyer activity:
- Create a new question joining CREDITS and BUYER SUPPLEMENTARY INFORMATION (Buyer == Company)
- Filter by "Transaction type" = "Retirement" AND by "Buyer Sector" NOT empty.
- Summarise by sum of "Credit Volume" (from Credits) by "Buyer Sector" (from Buyer Supplementary Info.)
- Visualise as a pie chart
This will show you which sectors are most active in retiring carbon credits.
Geographic Distribution
To analyse the geographic distribution of projects:
- Create a new question using the PROJECTS table
- Summarise by Count of rows by "Project Country"
- Count the number of projects
- Visualise as a bar chart
This will show you where carbon offsetting projects are concentrated globally.
Market Forecasting
Accessed through 'Prices and Markets' → 'Market Forecasts':
- Here you will be able to explore supply, demand and price forecasts for CDR and traditional VCM credits.
- We have various views including short term supply pipeline, corporate demand forecasts, as well as CDR price and capacity projections.
Carbon Price Risk Mitigation
Accessed through 'Policy & Compliance' → 'Compliance Markets' → 'Compliance eligible carbon credits':
- Here, you can find VCM credits eligible for compliance schemes and track CORSIA updates.
- You can also view our compliance eligibility tracker here, whereby you can filter by scheme, liquidity and compliance obligations, to then view eligible credits and calculate potential savings from retiring credits
Advanced Features
Metabase offers several advanced features for power users. This section covers some of the more sophisticated capabilities.
Creating Dashboards
Dashboards allow you to combine multiple questions into a single view:
- Click "New" in the top right and select "Dashboard"
- Give your dashboard a name and description
- Click "Add a question" to add existing questions to your dashboard
- Arrange and resize the cards as needed
- Add text cards for context and explanations
- Save your dashboard
Dashboards are great for creating executive summaries or monitoring key metrics that you will be constantly looking at in the future.
Custom Expressions
You can create custom expressions in the query builder:
- In the query builder, click on the "..." menu
- Select "Custom Expression"
- Write your expression using the available functions
- Give your expression a name
- Click "Done"
For example, you could create a custom expression to calculate the percentage of a project's credits that have been retired.
Scheduled Exports
You can schedule regular exports of questions or dashboards:
- Open the question or dashboard you want to export
- Click on the sharing icon in the top right
- Select "Subscriptions"
- Set up your schedule (daily, weekly, monthly)
- Choose the export format (CSV, Excel, etc.)
- Add email or Slack DM recipients
- Click "Done"
This is useful for regular reporting or keeping team members updated.